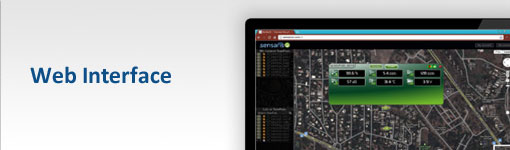
Accessible all over the world, this interface show you different views of your data. Charts, graphs, you can event select a period of time to study events in details.

You’ll see your Senspods geolocalized on a map, select one or several of them from here to see what they get from the field, in real time.


And finally, our administration section will let you manage your sensors fleet and give you an acess to download or upload raw data.